%%html
<script src="https://bits.csb.pitt.edu/preamble.js"></script>
Arrays
numpy arrays are dense, continuous, uniformly sized blocks of identically typed data values
import numpy as np
L = [[0,1],[2,3]]
A = np.array(L)
print("L:",L)
print("A:\n",A)
L: [[0, 1], [2, 3]]
A:
 [[0 1]
 [2 3]]
print(type(L),type(A))
<class 'list'> <class 'numpy.ndarray'>
Array Memory Layout
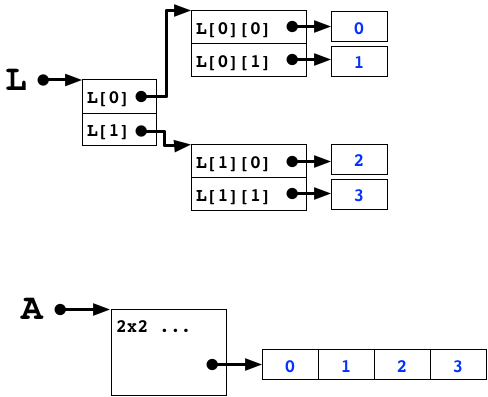
Array Memory
In the standard python interpretter, the return value of id is the memory address of the object.
print(id(L))
4448783488
print(id(L[1])-id(L[0])) #rows are far away
-128
print(id(L[0][1])-id(L[0][0])) #columns not so much, but 32 bytes?
32
Why does this matter?
Keeping data close together results in faster access times.
- It's easier to figure out the location of the data
- The data is more likely to fit in the processor's cache
If you have a block of dense numerical data, store it in a numpy array
Creating numpy Arrays
Note that np.ndarray and np.array are the same thing.
A = np.array([1,2,3,4])
A.dtype #type of what is stored in the array - NOT python types!
dtype('int64')
A.ndim #number of dimensions (axes in numpy speak)
1
A.shape #size of the dimensions as a tuple
(4,)
A.reshape((4,1)).shape #a column vector
(4, 1)
%%html
<div id="numpyi8" style="width: 500px"></div>

<script>
$('head').append('<link rel="stylesheet" href="https://bits.csb.pitt.edu/asker.js/themes/asker.default.css" />');

    var divid = '#numpyi8';
	jQuery(divid).asker({
	    id: divid,
	    question: "How much space does an int8 take up?",
		answers: ["1 byte","8 bytes","64 bytes","4 bytes"],
        server: "https://bits.csb.pitt.edu/asker.js/example/asker.cgi",
		charter: chartmaker})

$(".jp-InputArea .o:contains(html)").closest('.jp-InputArea').hide();


</script>
%%html

<div id="numpyi8z" style="width: 500px"></div>
<script>

    var divid = '#numpyi8z';
	jQuery(divid).asker({
	    id: divid,
	    question: "What is the largest number a int8 can store?",
		answers: ["127","128","255","256","inf"],
        server: "https://bits.csb.pitt.edu/asker.js/example/asker.cgi",
		charter: chartmaker})

$(".jp-InputArea .o:contains(html)").closest('.jp-InputArea').hide();

</script>
A = np.array([1,2,3,4]).reshape(4,1)
%%html

<div id="numpydim" style="width: 500px"></div>
<script>

    var divid = '#numpydim';
	jQuery(divid).asker({
	    id: divid,
	    question: "How many dimensions (axes) does A have?",
		answers: ["0","1","2","3","4"],
        server: "https://bits.csb.pitt.edu/asker.js/example/asker.cgi",
		charter: chartmaker})

$(".jp-InputArea .o:contains(html)").closest('.jp-InputArea').hide();

</script>
Initializing numpy Arrays
#can initialize an array with a list, or list of lists (or list of lists of lists, etc)
M = np.array([[1,2,3],[4,5,6.0]])
print(M.dtype,M.shape)
float64 (2, 3)
#if know the size, but not the data, can initialize to zeros:
Z = np.zeros((10,10))
#or ones
O = np.ones((5,10))
#or identity
I = np.identity(3) #this makes a 3x3 square identity matrix
print(Z.dtype) #note, default type is floating point
float64
Z = np.zeros((10,10),np.int64) #can change
print(Z.dtype)
int64
Indexing and Slicing
numpy arrays can be indexed and sliced a lot like python lists, but take tuples of values to reference each dimension.
M = np.array([[0,1,2],[3,4,5]])
M
array([[0, 1, 2],
       [3, 4, 5]])
print(M[1,1]) #indexing
print(M[0,-1]) #last item of first row
4
2
print(M[0,1:]) #can have slices - all but first column of first row
[1 2]
print(M[1],M[1,:]) #missing indices are treated as complete slices
[3 4 5] [3 4 5]
M = [[0,1,2],[3,4,5]]
%%html

<div id="numpytrick" style="width: 500px"></div>
<script>

    var divid = '#numpytrick';
	jQuery(divid).asker({
	    id: divid,
	    question: "What does M[1,1] return?",
		answers: ["0","1","2","3","4","5","Error"],
        server: "https://bits.csb.pitt.edu/asker.js/example/asker.cgi",
		charter: chartmaker})

$(".jp-InputArea .o:contains(html)").closest('.jp-InputArea').hide();

</script>
Advanced Slicing: Integer
numpy arrays support advanced indexing by arrays of integers or booleans:
A = np.array([0,1,4,9,16,25])
print(A[[2,5]]) #choose just indices 2 and 5
[ 4 25]
Advanced Slicing: Boolean
Indexing by Boolean numpy arrays can be used to select elements
b = A > 4
print(b)
[False False False True True True]
print(A[b])
[ 9 16 25]
Slicing Assignment
print("b =",b)
A[b] = 0
b = [False False False True True True]
print(A)
[0 1 4 0 0 0]
S = np.array(['a','b','c','b','a'])
S[S != 'a'] = 'z'
%%html

<div id="numpytrick2" style="width: 500px"></div>
<script>

    var divid = '#numpytrick2';
	jQuery(divid).asker({
	    id: divid,
	    question: "What is the value of S (concatenated together)?",
		answers: ["abcba","abzba","azzza","z","Error"],
        server: "https://bits.csb.pitt.edu/asker.js/example/asker.cgi",
		charter: chartmaker})

$(".jp-InputArea .o:contains(html)").closest('.jp-InputArea').hide();

</script>
Array Views vs. Copies
- A
numpyarray object has a pointer to a dense block of memory that stores the data of the array. - Basic slices are just views of this data - they are not a new copy.
- Binding the same object to different variables will not create a copy.
- Advanced slices will create a copy if bound to a new variable - these are cases where the result may contain elements that are not contiguous in the original array
Views
A = np.array([[0,1,2],[3,4,5],[6,7,8]])
B = A #A and B reference the _same_ object
A is B
True
B[0,0] = 1000
A
array([[1000,    1,    2],
       [   3,    4,    5],
       [   6,    7,    8]])
Sliced Views
row = A[1,:]
row
array([3, 4, 5])
row[2] = 5000
A
array([[1000,    1,    2],
       [   3,    4, 5000],
       [   6,    7,    8]])
Explicit Copy
newMat = A.copy() #this will actually copy the data
newMat[0,0] = 0
A
array([[1000,    1,    2],
       [   3,    4, 5000],
       [   6,    7,    8]])
newMat
array([[   0,    1,    2],
       [   3,    4, 5000],
       [   6,    7,    8]])
Advanced Slices Copy
A = np.array([[0,1,2],[3,4,5],[6,7,8]])
B = A[A > 4]
B
array([5, 6, 7, 8])
B[:] = -1
B
array([-1, -1, -1, -1])
A
array([[0, 1, 2],
       [3, 4, 5],
       [6, 7, 8]])
but...
A[A > 4] = -1
A
array([[ 0,  1,  2],
       [ 3,  4, -1],
       [-1, -1, -1]])
def z(M):
    M[:] = 0
A = np.array([1,2,3])
z(A)
%%html

<div id="numpyA" style="width: 500px"></div>
<script>

    var divid = '#numpyA';
	jQuery(divid).asker({
	    id: divid,
	    question: "What is the value of A?",
		answers: ["[0 0 0]","[1 2 3]","[0 2 3]","Error"],
        server: "https://bits.csb.pitt.edu/asker.js/example/asker.cgi",
		charter: chartmaker})

$(".jp-InputArea .o:contains(html)").closest('.jp-InputArea').hide();

</script>
Functions on Arrays
numpy includes a number of standard functions that will work on arrays
A = [1,2,3,4]
np.mean(A)
2.5
np.sum(A)
10
np.sin(A)
array([ 0.84147098, 0.90929743, 0.14112001, -0.7568025 ])
Axis
Most aggregation operations take an axis parameter that limits the operation to a specific direction in the array
- axis 0: across rows (apply operation to individual columns)
- axis 1: across columns (apply operation to individual rows)
b = np.arange(12).reshape(3,4); b
array([[ 0,  1,  2,  3],
       [ 4,  5,  6,  7],
       [ 8,  9, 10, 11]])
np.sum(b)
66
np.sum(b,axis=0)
array([12, 15, 18, 21])
np.sum(b,axis=1)
array([ 6, 22, 38])
%%html

<div id="numpyaxis" style="width: 500px"></div>
<script>

    var divid = '#numpyaxis';
	jQuery(divid).asker({
	    id: divid,
	    question: "How would I compute the largest column average of b?",
		answers: ["np.max(np.mean(b))","np.mean(np.max(b,axis=1))","np.max(np.mean(b,axis=0))","np.max(np.mean(b,axis=1))"],
        server: "https://bits.csb.pitt.edu/asker.js/example/asker.cgi",
		charter: chartmaker})

$(".jp-InputArea .o:contains(html)").closest('.jp-InputArea').hide();

</script>
Loading Data
genfromtxt (and the simpler loadtxt) will read in deliminated files.
np.genfromtxt('../files/Spellman.csv')
array([nan, nan, nan, ..., nan, nan, nan])
The defaul delimiter is whitespace which will not work with a csv
np.genfromtxt('../files/Spellman.csv',delimiter=',')
array([[           nan,  4.0000000e+01,  5.0000000e+01, ...,
         2.4000000e+02,  2.5000000e+02,  2.6000000e+02],
       [           nan, -7.0000000e-02, -2.3000000e-01, ...,
         5.7000000e-01,  0.0000000e+00,  1.0000000e-02],
       [           nan,  2.1500000e-01,  9.0000000e-02, ...,
        -1.0000000e-01,  2.7000000e-01,  2.3500001e-01],
       ...,
       [           nan, -2.5500000e-01, -3.6000000e-01, ...,
         8.4000000e-01, -3.9000000e-01, -4.1500000e-01],
       [           nan,  5.7000000e-01,  1.2000000e-01, ...,
        -1.2000000e-01,  6.9000000e-01,  5.5500000e-01],
       [           nan,  4.0500000e-01,  1.7000000e-01, ...,
        -8.0000000e-02,  6.5000000e-01,  5.2000000e-01]])
Why nan?
Loading Data
Recall that numpy arrays are dense, uniformly typed arrays. Can't mix a gene name (string) with expression values (float).
strdata = np.genfromtxt('../files/Spellman.csv',dtype=str,delimiter=',')
strdata
array([['time', '40', '50', ..., '240', '250', '260'],
       ['YAL001C', '-0.07', '-0.23', ..., '0.57', '0', '0.01'],
       ['YAL014C', '0.215', '0.09', ..., '-0.1', '0.27', '0.23500001'],
       ...,
       ['YPR201W', '-0.255', '-0.36', ..., '0.84', '-0.39', '-0.415'],
       ['YPR203W', '0.57', '0.12', ..., '-0.12', '0.69', '0.555'],
       ['YPR204W', '0.405', '0.17', ..., '-0.08', '0.65', '0.52']],
      dtype='<U12')
header = strdata[0,1:].astype(int)
genes = strdata[1:,0]
values = strdata[1:,1:].astype(float)
len(strdata),len(strdata[0])
(4382, 24)
%%html

<div id="strdatashape" style="width: 500px"></div>
<script>

    var divid = '#strdatashape';
	jQuery(divid).asker({
	    id: divid,
	    question: "What is the shape of genes?",
		answers: ["(4381,1)","(4381,)","(4381,24)","(4382,1)"],
        server: "https://bits.csb.pitt.edu/asker.js/example/asker.cgi",
		charter: chartmaker})

$(".jp-InputArea .o:contains(html)").closest('.jp-InputArea').hide();

</script>
help(np.genfromtxt)
Help on function genfromtxt in module numpy:

genfromtxt(fname, dtype=<class 'float'>, comments='#', delimiter=None, skip_header=0, skip_footer=0, converters=None, missing_values=None, filling_values=None, usecols=None, names=None, excludelist=None, deletechars=" !#$%&'()*+,-./:;<=>?@[\\]^{|}~", replace_space='_', autostrip=False, case_sensitive=True, defaultfmt='f%i', unpack=None, usemask=False, loose=True, invalid_raise=True, max_rows=None, encoding='bytes', *, ndmin=0, like=None)
    Load data from a text file, with missing values handled as specified.

    Each line past the first `skip_header` lines is split at the `delimiter`
    character, and characters following the `comments` character are discarded.

    Parameters
    ----------
    fname : file, str, pathlib.Path, list of str, generator
        File, filename, list, or generator to read.  If the filename
        extension is ``.gz`` or ``.bz2``, the file is first decompressed. Note
        that generators must return bytes or strings. The strings
        in a list or produced by a generator are treated as lines.
    dtype : dtype, optional
        Data type of the resulting array.
        If None, the dtypes will be determined by the contents of each
        column, individually.
    comments : str, optional
        The character used to indicate the start of a comment.
        All the characters occurring on a line after a comment are discarded.
    delimiter : str, int, or sequence, optional
        The string used to separate values.  By default, any consecutive
        whitespaces act as delimiter.  An integer or sequence of integers
        can also be provided as width(s) of each field.
    skiprows : int, optional
        `skiprows` was removed in numpy 1.10. Please use `skip_header` instead.
    skip_header : int, optional
        The number of lines to skip at the beginning of the file.
    skip_footer : int, optional
        The number of lines to skip at the end of the file.
    converters : variable, optional
        The set of functions that convert the data of a column to a value.
        The converters can also be used to provide a default value
        for missing data: ``converters = {3: lambda s: float(s or 0)}``.
    missing : variable, optional
        `missing` was removed in numpy 1.10. Please use `missing_values`
        instead.
    missing_values : variable, optional
        The set of strings corresponding to missing data.
    filling_values : variable, optional
        The set of values to be used as default when the data are missing.
    usecols : sequence, optional
        Which columns to read, with 0 being the first.  For example,
        ``usecols = (1, 4, 5)`` will extract the 2nd, 5th and 6th columns.
    names : {None, True, str, sequence}, optional
        If `names` is True, the field names are read from the first line after
        the first `skip_header` lines. This line can optionally be preceded
        by a comment delimiter. If `names` is a sequence or a single-string of
        comma-separated names, the names will be used to define the field names
        in a structured dtype. If `names` is None, the names of the dtype
        fields will be used, if any.
    excludelist : sequence, optional
        A list of names to exclude. This list is appended to the default list
        ['return','file','print']. Excluded names are appended with an
        underscore: for example, `file` would become `file_`.
    deletechars : str, optional
        A string combining invalid characters that must be deleted from the
        names.
    defaultfmt : str, optional
        A format used to define default field names, such as "f%i" or "f_%02i".
    autostrip : bool, optional
        Whether to automatically strip white spaces from the variables.
    replace_space : char, optional
        Character(s) used in replacement of white spaces in the variable
        names. By default, use a '_'.
    case_sensitive : {True, False, 'upper', 'lower'}, optional
        If True, field names are case sensitive.
        If False or 'upper', field names are converted to upper case.
        If 'lower', field names are converted to lower case.
    unpack : bool, optional
        If True, the returned array is transposed, so that arguments may be
        unpacked using ``x, y, z = genfromtxt(...)``.  When used with a
        structured data-type, arrays are returned for each field.
        Default is False.
    usemask : bool, optional
        If True, return a masked array.
        If False, return a regular array.
    loose : bool, optional
        If True, do not raise errors for invalid values.
    invalid_raise : bool, optional
        If True, an exception is raised if an inconsistency is detected in the
        number of columns.
        If False, a warning is emitted and the offending lines are skipped.
    max_rows : int,  optional
        The maximum number of rows to read. Must not be used with skip_footer
        at the same time.  If given, the value must be at least 1. Default is
        to read the entire file.

        .. versionadded:: 1.10.0
    encoding : str, optional
        Encoding used to decode the inputfile. Does not apply when `fname` is
        a file object.  The special value 'bytes' enables backward compatibility
        workarounds that ensure that you receive byte arrays when possible
        and passes latin1 encoded strings to converters. Override this value to
        receive unicode arrays and pass strings as input to converters.  If set
        to None the system default is used. The default value is 'bytes'.

        .. versionadded:: 1.14.0
    ndmin : int, optional
        Same parameter as `loadtxt`

        .. versionadded:: 1.23.0
    like : array_like, optional
        Reference object to allow the creation of arrays which are not
        NumPy arrays. If an array-like passed in as ``like`` supports
        the ``__array_function__`` protocol, the result will be defined
        by it. In this case, it ensures the creation of an array object
        compatible with that passed in via this argument.

        .. versionadded:: 1.20.0

    Returns
    -------
    out : ndarray
        Data read from the text file. If `usemask` is True, this is a
        masked array.

    See Also
    --------
    numpy.loadtxt : equivalent function when no data is missing.

    Notes
    -----
    * When spaces are used as delimiters, or when no delimiter has been given
      as input, there should not be any missing data between two fields.
    * When the variables are named (either by a flexible dtype or with `names`),
      there must not be any header in the file (else a ValueError
      exception is raised).
    * Individual values are not stripped of spaces by default.
      When using a custom converter, make sure the function does remove spaces.

    References
    ----------
    .. [1] NumPy User Guide, section `I/O with NumPy
           <https://docs.scipy.org/doc/numpy/user/basics.io.genfromtxt.html>`_.

    Examples
    --------
    >>> from io import StringIO
    >>> import numpy as np

    Comma delimited file with mixed dtype

    >>> s = StringIO(u"1,1.3,abcde")
    >>> data = np.genfromtxt(s, dtype=[('myint','i8'),('myfloat','f8'),
    ... ('mystring','S5')], delimiter=",")
    >>> data
    array((1, 1.3, b'abcde'),
          dtype=[('myint', '<i8'), ('myfloat', '<f8'), ('mystring', 'S5')])

    Using dtype = None

    >>> _ = s.seek(0) # needed for StringIO example only
    >>> data = np.genfromtxt(s, dtype=None,
    ... names = ['myint','myfloat','mystring'], delimiter=",")
    >>> data
    array((1, 1.3, b'abcde'),
          dtype=[('myint', '<i8'), ('myfloat', '<f8'), ('mystring', 'S5')])

    Specifying dtype and names

    >>> _ = s.seek(0)
    >>> data = np.genfromtxt(s, dtype="i8,f8,S5",
    ... names=['myint','myfloat','mystring'], delimiter=",")
    >>> data
    array((1, 1.3, b'abcde'),
          dtype=[('myint', '<i8'), ('myfloat', '<f8'), ('mystring', 'S5')])

    An example with fixed-width columns

    >>> s = StringIO(u"11.3abcde")
    >>> data = np.genfromtxt(s, dtype=None, names=['intvar','fltvar','strvar'],
    ...     delimiter=[1,3,5])
    >>> data
    array((1, 1.3, b'abcde'),
          dtype=[('intvar', '<i8'), ('fltvar', '<f8'), ('strvar', 'S5')])

    An example to show comments

    >>> f = StringIO('''
    ... text,# of chars
    ... hello world,11
    ... numpy,5''')
    >>> np.genfromtxt(f, dtype='S12,S12', delimiter=',')
    array([(b'text', b''), (b'hello world', b'11'), (b'numpy', b'5')],
      dtype=[('f0', 'S12'), ('f1', 'S12')])
(values-values.min())/(values.max()-values.min())
array([[0.51995439, 0.50171038, 0.51653364, ..., 0.59293044, 0.52793615,
        0.5290764 ],
       [0.55245154, 0.5381984 , 0.53078677, ..., 0.51653364, 0.55872292,
        0.55473204],
       [0.54503991, 0.54503991, 0.55302166, ..., 0.48916762, 0.55644242,
        0.54960091],
       ...,
       [0.49885975, 0.48688712, 0.49372862, ..., 0.62371722, 0.48346636,
        0.48061574],
       [0.59293044, 0.54161916, 0.51995439, ..., 0.51425314, 0.60661345,
        0.59122007],
       [0.57411631, 0.54732041, 0.52280502, ..., 0.51881414, 0.60205245,
        0.58722919]])
np.std((values-values.mean())/values.std())
0.9999999999999999
Project: Expression Data
https://MSCBIO2025.github.io/files/Spellman.csv
- Read this data into a numpy array
- Plot a histogram of the expression values for the first time point
- Plot a histogram of the expression values for the last time point
- Plot a histogram of the average expression value for the genes across all time points
- Plot the average expression value (across all genes) at each time point as a line graph
- Plot two series of average expression values: one for all genes where the first value is positive and the other for all genes where the first value is negative
import matplotlib.pyplot as plt
#bins = [-3,-2,-1,0,1,2,3]
#bins = np.linspace(-3,3,100)
plt.hist(values[:,0],bins=100);

plt.hist(values[:,-1],bins=100);

bins = np.linspace(-3,3,100)
plt.hist(values[:,0],bins=bins, alpha=0.5,label="ts-40")
plt.hist(values[:,-1],bins=100,alpha=0.5,label="ts-260")
plt.legend(loc="best");
plt.xlabel("Expression", size=14)
plt.ylabel("Number of Instances", size=14)
Text(0, 0.5, 'Number of Instances')

plt.hist(values.mean(axis=1),bins=100);

plt.plot(header,values.mean(axis=0))
plt.xlabel("Time",size=14)
plt.ylabel("Avg. Expression",size=14);

plt.plot(header,(values[values[:,0]>0]).mean(axis=0),label="positive")
plt.plot(header,(values[values[:,0]<0]).mean(axis=0),label="negative");
plt.xlabel("Time",size=14)
plt.ylabel("Avg. Expression",size=14)
plt.legend()
<matplotlib.legend.Legend at 0x120b7e3d0>
