Recall
from matplotlib.pylab import cm
import numpy as np
import scipy.cluster.hierarchy as hclust
import matplotlib.pyplot as plt
data = np.genfromtxt('Spellman.csv',skip_header=1,delimiter=',')[:,1:]
Z = hclust.linkage(data,method='complete')
leaves = hclust.leaves_list(Z)
ordered = data[leaves]
print(data.shape)
plt.matshow(ordered,aspect=0.01,cmap=cm.seismic);
(4381, 23)

%%html
<div id="howdim" style="width: 500px"></div>
<script>
$('head').append('<link rel="stylesheet" href="http://bits.csb.pitt.edu/asker.js/themes/asker.default.css" />');

    var divid = '#howdim';
	jQuery(divid).asker({
	    id: divid,
	    question: "What is the dimensionality of this data?",
		answers: ['1','2','23','4381','None of the above'],
        server: "http://bits.csb.pitt.edu/asker.js/example/asker.cgi",
		charter: chartmaker})

$(".jp-InputArea .o:contains(html)").closest('.jp-InputArea').hide();


</script>
Dimenionality Reduction
$$f(\mathbb{R}^N) \rightarrow \mathbb{R}^M, M < N$$Usually used for visualization so reduce to 2 or 3 dimensions.
Goal is for distances in $\mathbb{R}^M$ to be representative of distances in $\mathbb{R}^N$
PCA
Recall: principal component analysis finds an orthogonal basis that best represents the variance in the data.

from sklearn.decomposition import PCA
model = PCA(n_components=2) #specify number of components
pcaresult = model.fit_transform(data)
model.explained_variance_ratio_
array([0.29005293, 0.15421722])
pcaresult
array([[ 0.53743596,  0.04236286],
       [-0.52117275,  0.23262808],
       [-0.92718811, -0.02687601],
       ...,
       [ 2.22481438, -0.63181588],
       [-1.90513202,  0.62147873],
       [-1.52881942,  1.02728415]])
plt.scatter(pcaresult[:,0],pcaresult[:,1],s=4,alpha=.1)
plt.xlabel('PCA1'); plt.ylabel('PCA2');

import seaborn as sns
plt.figure(figsize=(16,2))
sns.heatmap(model.components_,cmap=cm.seismic,yticklabels=['PC1','PC2'],
            square=True, cbar_kws={"orientation": "horizontal"});

import sklearn.datasets
X,color=sklearn.datasets.make_swiss_roll(n_samples=2000)
fig = plt.figure(figsize=(10,10))
ax = plt.axes(projection='3d')
ax.scatter(X[:, 0], X[:, 1], X[:, 2], c=color, cmap=plt.cm.Spectral);

%%html
<div id="howpca" style="width: 500px"></div>
<script>
$('head').append('<link rel="stylesheet" href="http://bits.csb.pitt.edu/asker.js/themes/asker.default.css" />');

    var divid = '#howpca';
	jQuery(divid).asker({
	    id: divid,
	    question: "What will the PCA projection to 2D of this data look like?",
		answers: ['Gaussian','Gradient','Spiral','Messy','Square'],
        server: "http://bits.csb.pitt.edu/asker.js/example/asker.cgi",
		charter: chartmaker})

$(".jp-InputArea .o:contains(html)").closest('.jp-InputArea').hide();


</script>
model = PCA(n_components=2) #specify number of components
result = model.fit_transform(X)
plt.scatter(result[:,0],result[:,1],c=color,cmap=plt.cm.Spectral);

Is this a better projection?
plt.scatter(color,X[:,1],c=color,cmap=plt.cm.Spectral);

UMAP: Uniform Manifold Approximation & Projection
https://umap-learn.readthedocs.io/en/latest/index.html
Idea: Prioritize respecting local distances in embedding space.
UMAP: Uniform Manifold Approximation & Projection
UMAP constructs a $k$-nearest neighbors graph of the data. It uses an approximate stochastic algorithm to do this quickly.
UMAP: Uniform Manifold Approximation & Projection
Optimizes position of data points in low dimensional space to balance attraction of locally adjacent points and repulsion of unconnected, distance points.
$$\mathrm{minimize}\sum_{e\in E} \color{blue}{ w_h(e) \log\left(\frac{w_h(e)}{w_l(e)}\right)} + \color{darkred}{(1 - w_h(e)) \log\left(\frac{1 - w_h(e)}{1 - w_l(e)}\right)}$$$w_h(e)$ weight of edge in high dimensional space (larger weight = smaller distance)
$w_l(e)$ weight of edge in low dimensional space (larger weight = smaller distance)
This optimization is done using stochastic gradient descent starting at a deterministically constructed initial embedding.
UMAP: Uniform Manifold Approximation & Projection
The umap package is installed with pip3 umap-learn
import umap
model = umap.UMAP()
result = model.fit_transform(data)
plt.scatter(result[:,0],result[:,1],s=4,alpha=.1);

PCA
plt.scatter(pcaresult[:,0],pcaresult[:,1],s=4,alpha=.1);

UMAP Parameters
n_neighbors(15): Number of nearest neighbors to consider. Increase to respect global structure more.min_dist(0.1): Minimum distance between points in reduced space. Decrease to have more tightly clustered points.metric("euclidean"): How distance is computed. Can provide user-supplied functions in addition to standard metrics
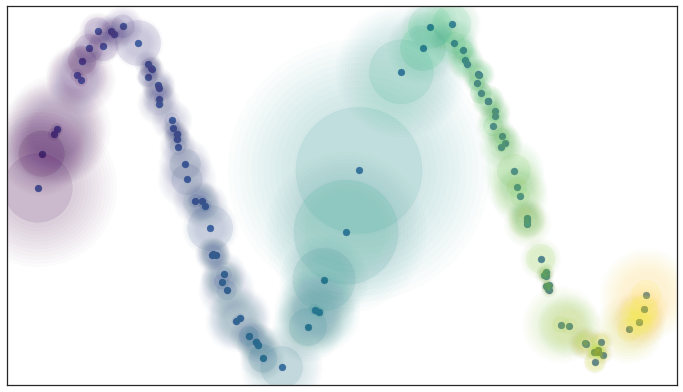
model = umap.UMAP(); result = model.fit_transform(X)
plt.scatter(result[:,0],result[:,1],s=4,c=color,cmap=plt.cm.Spectral);

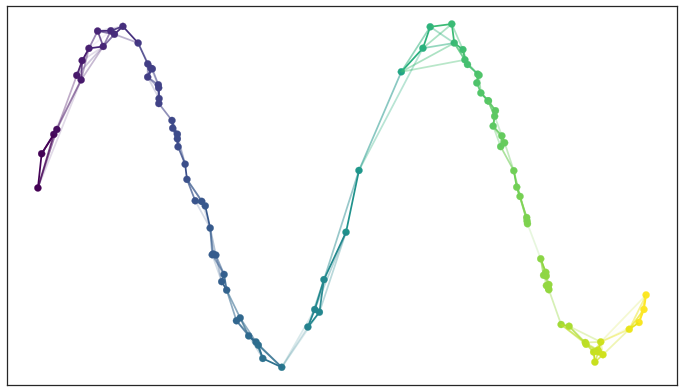
n_neighbors
model = umap.UMAP(n_neighbors=3); result = model.fit_transform(X)
plt.scatter(result[:,0],result[:,1],s=4,c=color,cmap=plt.cm.Spectral);

n_neighbors
model = umap.UMAP(n_neighbors=100); result = model.fit_transform(X)
plt.scatter(result[:,0],result[:,1],s=4,c=color,cmap=plt.cm.Spectral);

min_dist
model = umap.UMAP(n_neighbors=100,min_dist=1); result = model.fit_transform(X)
plt.scatter(result[:,0],result[:,1],s=4,c=color,cmap=plt.cm.Spectral);

metric
fig,axes = plt.subplots(ncols=2,figsize=(12,6))
model = umap.UMAP(metric='euclidean')
result = model.fit_transform(X)
axes[0].scatter(result[:,0],result[:,1],s=4,c=color,cmap=plt.cm.Spectral); axes[0].set_title('euclidean')
model = umap.UMAP(metric='cosine')
result = model.fit_transform(X)
axes[1].scatter(result[:,0],result[:,1],s=4,c=color,cmap=plt.cm.Spectral); axes[1].set_title('cosine');

UMAP vs. t-SNE
t-SNE (t-distributed stochastic neighbor embedding) is an older method that also uses a notion of preserving local distances
- doesn't use nearest neighbor graph (slower)
- different cost function for optimizing embedding
- more sensitive to parameters
- default to stochastic initialization of optimization
Project
Download the below heavily downsampled RNASeq data and visualize it in 2D both with PCA and UMAP.
Color the points by the labels.
!wget  http://mscbio2025.net/files/mouse_data/X.csv.gz
!wget  http://mscbio2025.net/files/mouse_data/obs.csv
--2022-10-18 02:44:04--  http://mscbio2025.net/files/mouse_data/X.csv.gz
Resolving mscbio2025.net (mscbio2025.net)... 136.142.4.139
Connecting to mscbio2025.net (mscbio2025.net)|136.142.4.139|:80... connected.
HTTP request sent, awaiting response... 200 OK
Length: 5447648 (5.2M) [application/x-gzip]
Saving to: ‘X.csv.gz.1’

X.csv.gz.1          100%[===================>]   5.19M  14.5MB/s    in 0.4s

2022-10-18 02:44:05 (14.5 MB/s) - ‘X.csv.gz.1’ saved [5447648/5447648]

--2022-10-18 02:44:05--  http://mscbio2025.net/files/mouse_data/obs.csv
Resolving mscbio2025.net (mscbio2025.net)... 136.142.4.139
Connecting to mscbio2025.net (mscbio2025.net)|136.142.4.139|:80... connected.
HTTP request sent, awaiting response... 200 OK
Length: 101150 (99K) [text/csv]
Saving to: ‘obs.csv.1’

obs.csv.1           100%[===================>]  98.78K  --.-KB/s    in 0.06s

2022-10-18 02:44:05 (1.67 MB/s) - ‘obs.csv.1’ saved [101150/101150]
data = np.genfromtxt('X.csv.gz',delimiter=',')
labels = np.genfromtxt('obs.csv',delimiter=',',dtype=str,skip_header=1)[:,1]
#convert labels (strings) to numbers so they can be used as colors in matplotlib
from sklearn import preprocessing
colors = preprocessing.LabelEncoder().fit_transform(labels)
data.shape
(1196, 4286)
labels.shape
(1196,)
#can use umap's plotting function and provide labels as strings
import umap.plot
pca = PCA(n_components=2)
pcaD = pca.fit_transform(data)
plt.scatter(pcaD[:,0],pcaD[:,1],s=4,c=colors)
plt.xlabel('PCA1'); plt.ylabel('PCA2');

model = umap.UMAP(n_neighbors=100)
uD = model.fit(data)
umap.plot.points(uD, labels=labels)
<AxesSubplot:>
